Must-Have Org Charts to Visualize Your Company or Project Team Structure

Every firm or organization works on a system that organizes its employees and leaders in a hierarchy or role positions. Sometimes these are straightforward hierarchies that categorize the employees in a firm. However, sometimes firms employ more complex and matrix-type structures, considering cross-functionality and other factors that do not neatly fit into a traditional hierarchical structure. Firms visualize this relationship between their employees through the use of Org Charts. Org (or Organization) Charts are diagrams consisting of boxes and simple lines containing each employee’s name and relative position in the company, showcasing the hierarchy of the work structure in place.
WHY ARE ORG CHARTS IMPORTANT?
If used well, Org Charts can be great at visualizing simple hierarchical lines and more complex matrix arrangements in your presentations. Org Charts efficiently use them for various purposes, including knowing the state of reporting relationships, mapping communications flows, etc. These Ppt templates can specifically help in –
- Supervisory Communication – The org chart clarifies the organization’s reporting relationships and communication lines. It becomes clear who is responsible for cascading messages to what part of the organization. It also allows employees to understand who to approach when discussing something specific.
- Restructuring – A clear visualization of your workforce and its utilization in the company’s operations can sometimes reveal inconsistencies and gaps. This can prompt restructuring efforts if needed.
- Planning – Org charts can be used to represent the organization’s current state and as a map of the future state. Visual representations of your workforce and structure can make it easier to plan your next steps. For effective planning, org charts visually represent an organization’s structure, but integrating Vena’s dynamic workforce planning template allows for a more comprehensive understanding of current status and future changes, enhancing strategic decision-making in managing human resources.
- Resource Strategy – A company has finite resources. Understanding your internal structures through an Org Chart can make understanding which resources are scarce/shared easier and require proper optimization efforts.
ORG CHARTS THAT EFFECTIVELY VISUALISE YOUR COMPANY’S INTERNAL STRUCTURES
Hierarchy Charts
A Hierarchy Chart is the simplest and oldest form of Org Charts. It represents an org with a straightforward hierarchy of a figurehead, with branches representing employees descending their ranking or positions within the firm. It forms a pyramid shape due to the number of branches increasing as you go down the hierarchy and move from leadership positions within departments to simple, salaried employees within the department.
These charts are best used for representing hierarchical organizational structures at the Divisional, Business Unit, or project level.
Vertical Charts

This chart is used to emphasize the senior management layer by putting them in focus. These are drawn up for business units in larger organizations or representing a company’s top management.

This version expands on the previous by adding the next level of hierarchy and putting them in focus. This chart is especially great for showcasing teams and is typically used in internal discussions on clarifying roles and responsibilities. This chart is vertically organized. This sometimes indicates an implicit hierarchy in the team, e.g., the newest/juniormost team is at the bottom of the list.
Here are some more examples for you:
This Organisation Chart is a tabular and diagrammatic representation of each team member’s position and duties under the team’s structure.
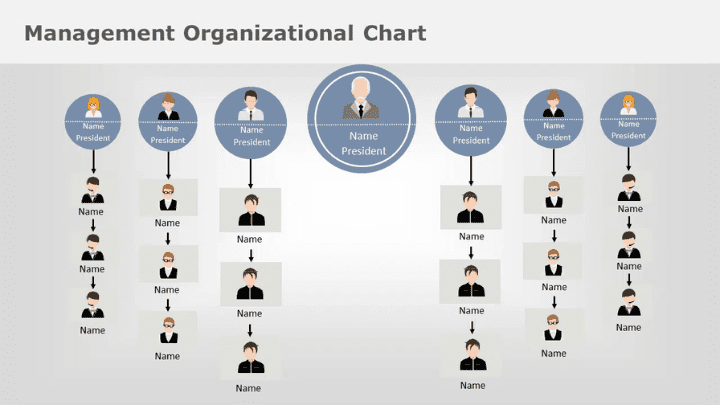
This Management Organisation Chart is specifically designed to clarify and articulate a company’s repository of managers, leaders, and heads. This template is designed to break down the hierarchy of positions starting from the CEO, Presidents, and further down the line. Having clarity regarding your upper management is crucial for the functioning of your organization, and this chart allows you to envision each member of your managerial cohort as part of the larger structure.

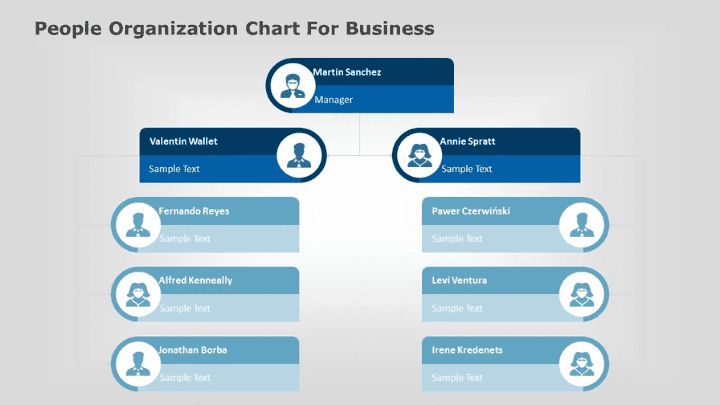
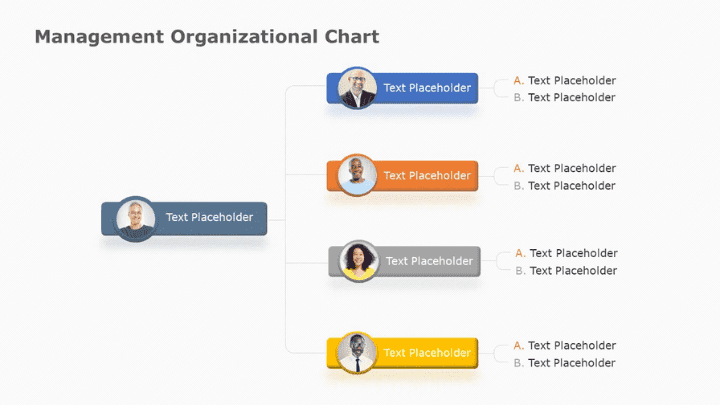
This template allows you to show each member clearly, with their designation, photo, and placement in the hierarchy. And that’s to clearly visualize the core team members of a department or larger functional or cross-functional team.
Horizontal Management Org Chart
This Org Chart uses simple yet effective shapes and colors to show management hierarchy within a firm distinctively. Typically, a horizontal structure has only 2 or 3 chains of command and is basically flat.
Flat Team Structure Charts
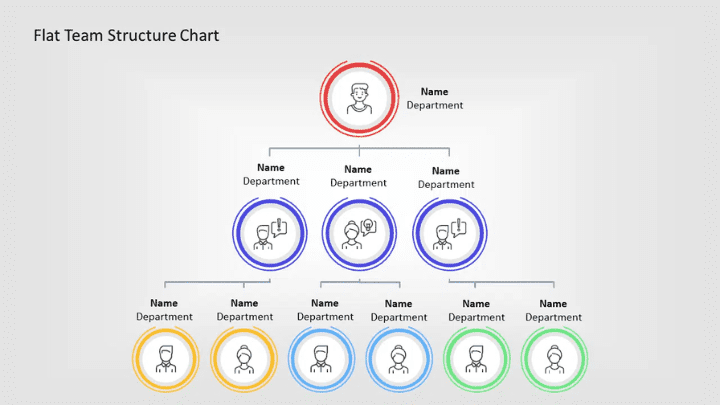
Sometimes it is helpful to show team members in a flat layout. And that’s to avoid rubbing off impressions of an implicit hierarchy within teams. That’s where the flat team structure representation is helpful. This avoids unintended messaging around structural topics, especially since they can tend to be very sensitive.
Let’s check out another version:

To summarize, flat org structures reduce unnecessary layers of managers to improve coordination and productivity and quicker decision-making. However, a caveat is that the managers need to be generalists who can handle a variety of work.
Horizontal Hierarchy Charts
A Horizontal Multi-Level Hierarchy chart is a beneficial construct, especially when corporate or central functions need to be displayed in the org chart. Typically this view will carry corporate/central functions like Legal, HR, Finance, etc., on the top part of the fishbone and the hierarchical business line functions underneath.
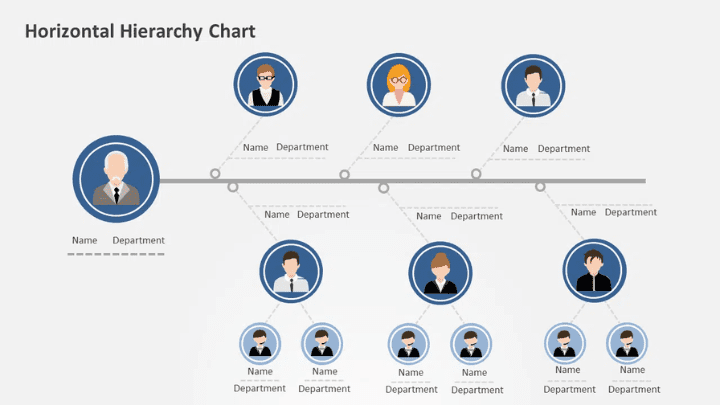
This Multi-Level Hierarchy chart utilizes the concept of a horizontal straight line branching off into smaller levels by delineating smaller, single-person represented departments on top of the line. The larger departments below the line are then further branched out to include each team member.
Matrix Organisational Structure Charts
In an increasingly complex corporate structure, roles are segregated to emphasize functional expertise on one hand and operational focus on the other. These structures can enhance effectiveness but require careful definitions of reporting patterns and role descriptions.
A Matrix Organisational Structure Chart helps visualize these relationships. This chart is primarily used to show the interconnectedness of departments and teams.
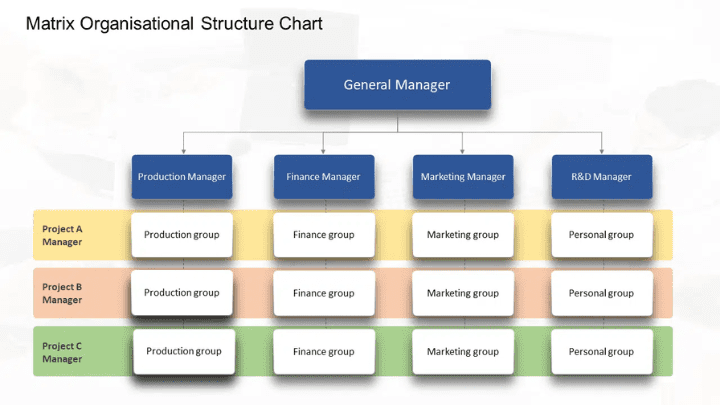
The Matrix Organisational Structure Chart is laid out in a grid format. General Manager is the highest authority, followed by a top row of department heads and a leftmost column of project managers. By placing all employees within this matrix, you can clearly show the department head and project manager a particular person must report to.
Here is another version to check out:

The 5 Level Managers Matrix consists of 5 levels of managers usually found in a project management setup – VPs of Design, Manufacturing, Finance, Marketing, and HR in the top row of the matrix. On the leftmost column are the project managers for each project listed. This creates a grid that can then be filled in with the respective employees engaged in each project and part of that department. This template also uses colors and shapes to build connections, making grasping the matrix at first glance easier.
CONCLUSION
Org Charts are handy in presenting the organizational structures of your company. Just make sure to be clear in your purpose and definition, gather all the relevant information, select the category of org charts that will fit your purpose, and plan for changes and modifications in the future before starting your Org Charts. After all, this diagram is broken down your company’s structure to its bare bones and is exactly what organizations need to keep on top of their internal workings and structure.
Subscribe to our newsletter