Must-Know Black Friday & Cyber Week Ecommerce Statistics for 2019 [Infographic]
As we head into the end of 2019 and into 2020, we all know at this point that ecommerce sales are exploding, while traditional retail is in decline.
But what are the ecommerce statistics to prove it?
Let’s dig in.
Offline vs Online Cyber Week Trends
With all this talk about the explosion of digital commerce, you’d think retail spending is completely dead.
Not so fast.
Research shows that Black Friday brick and mortar store visits dropped 9% last year, while ecommerce sales increased 23%. In 2018, $6.22 billion was spent on Black Friday, and more are expected in 2019.
That’s a big jump year over year.
While impressive, we do have to keep these numbers in context. However, as overall Black Friday sales hit $717.5 billion in 2018, up 4.3% from the $682 billion spent in 2017. This is a monumental amount, and ecommerce actually only makes up about $6.2 billion of that number.
With the history of Black Friday going all the way back to the early 1900s. There’s a long history of traditional shopping during this period that’s hard for consumers to shake.
Nevertheless, ecommerce is the new frontier, rapidly growing and rapidly changing.
Mobile Shopping is Now Commonplace
Smartphones and improved mobile networks have definitely compelled consumers to do primary and secondary shopping on their phones. Mobile data speeds are increasing rapidly, from 3G to 4G and in some areas, 5G speeds that make browsing a joy.
Ecommerce statistics research from Adobe Analytics shows that in 2018, 67% of all digital traffic generated on Black Friday came from mobile devices, compared to 61% in 2017. This is huge, it’s not only a 10% increase year-over-year but solidly puts mobile usage in the firm majority of traffic.
How does this apply to business owners? One takeaway for business owners is to always try to improve site speed, as one study showed that a 1-second speed delay could cost Amazon up to $1.6 billion. You’re not going to risk that amount if you run a small to medium-sized business, but the impact is real.
Mobile may still be more of a browsing and research experience when compared to desktop, however, as the volume and value of orders still, skew towards the desktop.
In one research report, National Retail Federation found 66% of all American consumers used mobile devices to compare products and prices on the weekend following Thanksgiving. Although that’s impressive, BigCommerce found that desktop orders averaged $122.37, smartphone orders averaged $88.25 and tablet orders averaged $107.06.
What this shows is that consumers maybe not as comfortable buying on mobile for larger purchases, and still prefer the larger desktop experience. Nevertheless, mobile is rising and will continue to play a huge part.
Amazon Dominates
The landscape of digital shopping is not evenly distributed. It favors one giant: Amazon.
The company accounted for 56.6% of all online sales on Black Friday in 2018. For one company, that’s a huge proportion of sales, leaving the remaining amounts for all other retailers combined.
CBS reported that Amazon had its biggest Black Friday and Cyber Monday in history in 2018. While the retailer did not provide sales figures, it reported that it sold over 180 million items during the five day period between Thanksgiving and Cyber Monday. That’s just about one item for every two people living in the U.S. Imagine the logistics to delivery to that many people in that short amount of time.
Do people trust Amazon for the best deal? It’s somewhat mixed. It seems that most consumers know they have to continue to shop around and not just trust one source like Amazon for all deals. In one study, 29% of American shoppers said they trusted Amazon to have the best Black Friday deals in 2018, while 25% said they thought Walmart would save them the most money. This is shocking that Walmart is still held in such regard as we head into 2020.
Social Media Cyber Week Highlights
Social media tends to be a huge driver of eyeballs, but typically not of commerce. But with Instagram stepping more into the commerce space, that may change. Taking a look at some of the social media-related ecommerce statistics reveals changes in the landscape.
For example, Global Webindex shows that 42% of U.S. and U.K. shoppers now research brands, products and services through social media sites before making a purchase on Black Friday and throughout the year. This is a high percentage of people consulting friends AND strangers on social media.
Breaking down the social networks, even more, we see there’s still a huge lean towards Facebook-owned properties over all other social media platforms. The National Retail Federation revealed that 17% of all U.S. shoppers used Facebook to make Black Friday purchases in 2018, while 9% used Instagram, 4% used Pinterest and 4% used Twitter.
In another battle for the handset wars, we have this interesting stat: the average order value for iPhone users during Cyber Week 2018 was $90.45, compared to $84.10 for Android users, according to BigCommerce. This does line up with similar trends we’ve seen in the past between iPhone and Android users, and we’ll expect to see more.
I predict we’ll be seeing some big numbers move even more regarding social media and ecommerce in 2019 and 2020.
Small Business Takeaways
Compared to big brands with huge budgets, small businesses need to be resourceful and scrappy. They need to make do with less. Often that means wearing many hats as managers or building their own website without professionals.
Small business owners should create campaigns and ideas that aren’t costly but stand out, both online and offline. Whether it’s partnering with other companies, bundling products, or participating in Small Business Saturday.
Finally, smaller companies selling online should research these ecommerce statistics thoroughly and create an action plan for applying the lessons on their own site. Managers shouldn’t try to apply all of these at once but practically adapt them for their own business.
Consumer Trends
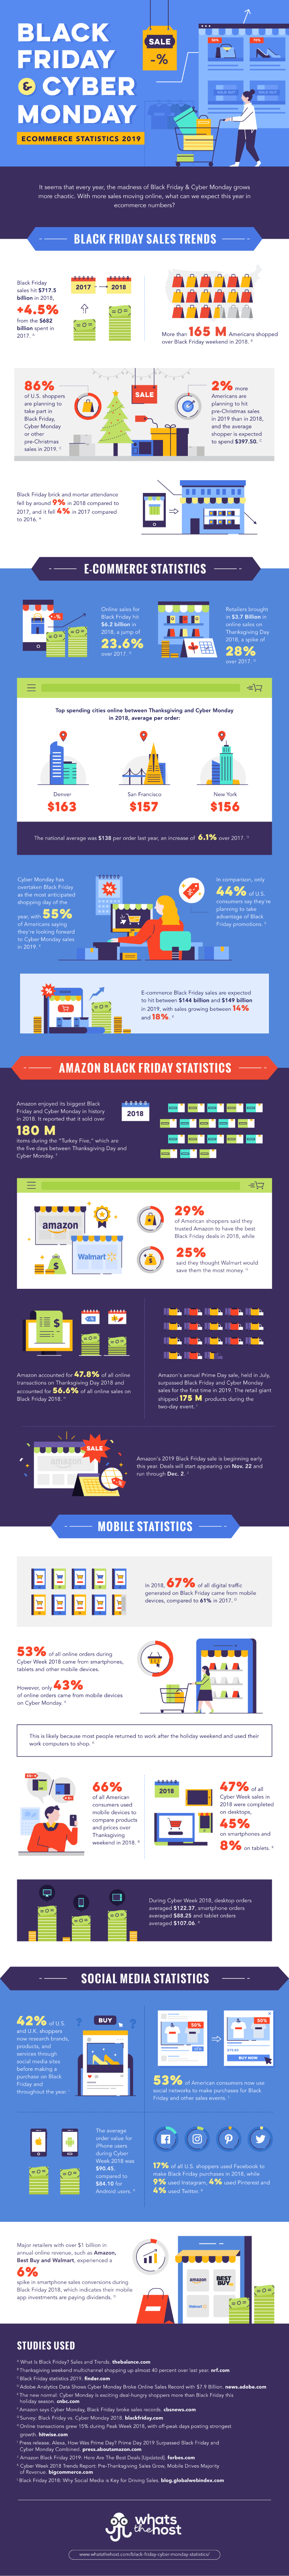
While some claim that they don’t fall for the Cyber Week sales, research shows that 86% of shoppers are planning to take part in Black Friday, Cyber Monday or other pre-Christmas sales in 2019.
Web hosting and technology review site WhatsTheHost researched the most interesting Black Friday and Cyber Monday ecommerce statistics that you need to know this year and visualized them in this infographic.
Take a look at the infographic below and use the data for your own holiday media and marketing planning.
Subscribe to our newsletter